
It’s nearly impossible to hop on Twitter or turn on the nightly news without hearing about the stock market.
One day the S&P 500 is up, the next day the Dow Jones is down.
One financial expert predicts this bull market — the longest on record — will continue for the foreseeable future. Another encourages you to reallocate your assets now because a bear market is coming.
Through it all, the stock market continues to rise and fall. That up-and-down change in stock and market prices is known as volatility. Volatility is why many Americans find investing to be intimidating, if not downright scary — but it shouldn’t be.
Market volatility is as natural as the sun rising and setting. But, what exactly is it? Why does it occur? And how does it impact you as an investor?
Step into our “classroom” to learn more about the world of volatility.
The SparkNotes Take: What Is Volatility?
Volatility is the up-and-down change in the price or value of an individual stock or the overall market during a given period of time. Volatility can be measured by comparing current or expected returns against the stock or market’s mean (average), and typically represents a large positive or negative change.
You might not recognize it, but you’ve heard numerous stories in the news about volatility. Think about headlines like the minute-by-minute swings of cryptocurrencies like Bitcoin, a surge in a startup’s value after promising quarterly reports or a stock that suddenly drops after the company’s controversial CEO departs.
Related concepts include annualized historical volatility, implied volatility, and the CBOE Volatility Index, or VIX.
Annualized historical volatility is volatility presented in an annualized format; i.e. how much volatility the stock market has experienced within the past year.
Implied volatility is a way of estimating a stock’s future volatility.
The VIX, which is sometimes called the “fear index,” is what most traders look at when trying to decide on a stock or options trade. Calculated by the Chicago Board Options Exchange (CBOE), it’s a measure of the market’s expected volatility through S&P 500 index options.
Watch Now: How to Invest in a Volatile Market and Tips for Riding Out the Roller Coaster
Crunching the (Volatility) Numbers in Excel
For those of you who like to see exactly how numbers work out, here’s how to calculate volatility in Excel:
- Choose a stock and determine the time frame for which you want to measure. (For this example, we’re using 20 days.)
- Enter the stock’s closing price for each of the 20 days into cells B2-B22, with the most recent price at the bottom. (Pro tip: You’ll need 21 days’ worth of data to calculate the returns for a 20-day period.)
- Next, you need to compute interday returns. This can be done by dividing the stock’s current closing price by the previous day’s closing price, then subtracting 1. Enter each amount into the appropriate cell in column C.
- In cell C23, enter “=STDV(C3:C22)” to calculate the standard deviation for the past 20 days. This is the volatility during this time.
- To calculate the annualized historical volatility, enter “SQRT(252)*C23” in cell C24.
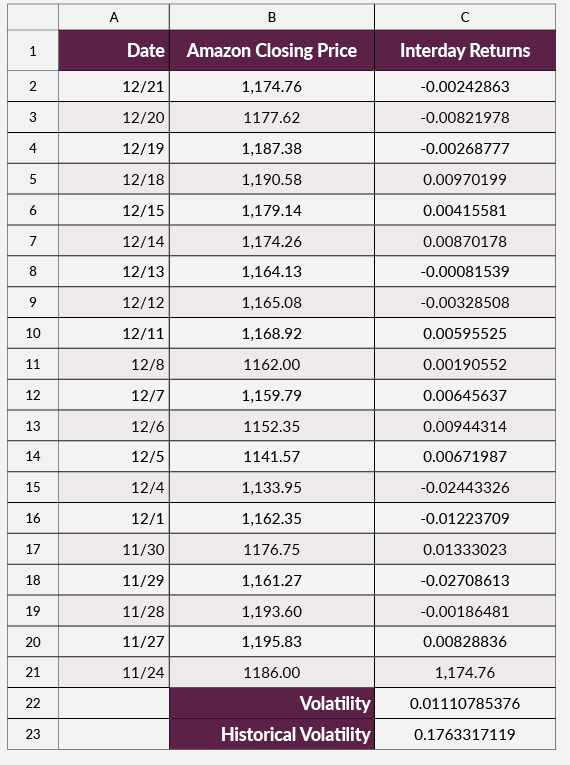
*Examples provided in chart above are for instructional purposes only.
Options traders are often interested in calculating implied volatility, which is much more complicated because it’s just a projection. Learn more about implied volatility.
Behind the Highs and the Lows
Volatility happens every trading day. The reason behind it depends on the stock itself, the stock’s sector, or several other instances.
Some smaller, cheaper stocks (think “penny stocks,” i.e. stocks that trade for less than $1), or those in emerging or unregulated industries (such as marijuana companies or cryptocurrencies), often experience extreme volatility on a daily basis.
Sometimes entire sectors suffer from a change in government policy, like when the industrial sector dropped following a breakdown in trade negotiations between the U.S. and China.
Market volatility is also common when public companies release their quarterly reports. These reports are important for investors because they look at a company’s year-over-year growth and revenue, which can help predict future earnings potential or reveal red flags.
What’s Good, High or Low Volatility?
It depends.
The lower a stock’s volatility, the lower the risk for the investor. If you’re closer to retirement or worried about another financial crisis reducing your life savings, investments with low volatility should probably make up the majority of your portfolio. This is why many financial advisors suggest those nearing retirement place a larger percentage of their money in bonds — they’re less volatile.
On the other hand, while a stock with higher volatility represents higher risk — it also offers potentially greater reward. A highly volatile stock often experiences highs (and lows) at an uneven rate. If you’re a younger investor with more time to take chances and have a high risk tolerance, it could be wise to invest a larger portion of your retirement savings in stocks.
So, should you invest in low-volatile stocks and bonds or high-volatile stocks? The correct answer is a combination of both, depending on your age, goals, and risk tolerance.
Thanks for the Info. Now What?
Now that you know what volatility is, how it’s calculated, and what causes it, the next step is to continue living your life and investing in a way that will help you reach your financial goals.
Not the answer you were expecting? The truth of the matter is that, for most Americans, the daily stock market headlines you see aren’t completely relevant. And the average investor shouldn’t lose sleep over daily and weekly stock market volatility.
Instead, focus on the long term. Did you know the average annual return on the overall stock market has been 7 percent? There has been a lot of stock market volatility during that time — including four U.S. stock market crashes.
But through Black Monday, the Dot.com Bust, and Great Recession, investors who have panicked and reacted to market volatility are typically the ones who have lost the most potential earnings. The winners have been investors who kept the long-term view in mind and remained calm through volatility.
Comment on this article
Comment